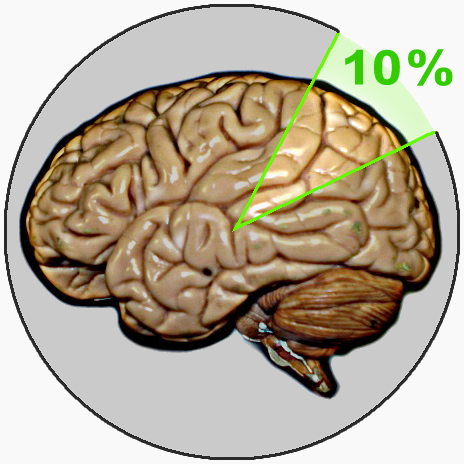
We only remember 10% of what we read and 20% of what we hear - known as 'Dale's Cone of Experience.'
Dale's Cone was originally about instructional media, not retention percentages. The specific percentages were added later by anonymous sources and have no scientific basis.
What changed?
Every year, corporate trainers open their presentations with a pyramid graphic attributed to Edgar Dale, an educational theorist at Ohio State University. The pyramid shows that people remember 10 percent of what they read, 20 percent of what they hear, 30 percent of what they see, and so on up to 90 percent of what they do. The numbers are precise, memorable, and arranged into a tidy visual hierarchy that implies research grounding and practical guidance. They are also completely fabricated. Edgar Dale never wrote these numbers. They do not appear in any scientific study. Attempts to trace them to their source have led researchers on a decades-long hunt through archives, military records, and university libraries, and turned up nothing.
Dale published his Cone of Experience in 1946, in a textbook on audiovisual methods in teaching. The original cone was a diagram organizing instructional media from most abstract, verbal symbols at the top, to most concrete, direct purposeful experiences at the bottom. It was a conceptual organizing framework, not an empirical chart. Dale explicitly noted that the cone described the nature of experience, not how much of it would be retained. He attached no percentages. He drew no conclusions about how much a student would remember from a lecture versus a hands-on activity.
The percentages appeared sometime around 1970, grafted onto a visual resembling Dale's cone by an unknown party or parties. The educational researcher Michael Molenda traced the history in a 2003 article in Educational Technology, following the numbers back through instructional design texts and training manuals, finding that each citation led to another citation with no trail to primary data. The specific set of figures, 10, 20, 30, 50, 70, 90, appeared occasionally in different arrangements, sometimes attributed to Dale, sometimes to "research," sometimes to unnamed military studies. None of the attributions led to a real source.
The Army's Aberdeen Proving Ground was one suggested origin, based on a vague reference in an instructional design text. When researchers actually examined Aberdeen's archives, they found nothing resembling a study producing these retention figures. The numbers were not wrong conclusions from legitimate research. They were invented.
What made them durable was their usefulness. A trainer arguing for more interactive workshops needs a compelling reason not to deliver a lecture. The retention pyramid provided one, wrapped in the authority of specific percentages. A teacher arguing for hands-on learning over textbooks had the same use for it. The specificity, not "more" but "exactly 30 percent more", conferred an aura of scientific precision that made the claim harder to challenge than a simple assertion. People reproduced the chart in good faith because they had seen it reproduced in good faith.
Dale's actual Cone of Experience described something real about the relationship between abstraction and concreteness in learning. The research on how different instructional methods affect retention is genuine, and does suggest that active engagement tends to produce better outcomes than passive exposure. But the evidence doesn't produce universal percentages that hold across subjects, populations, and contexts. The phantom numbers hijacked a legitimate framework and turned it into a citation for something that had never been studied.
By the 2000s, the claim had propagated so widely through corporate training programs, teacher education curricula, and instructional design textbooks that debunking it became itself a minor industry. The chart remains in circulation today, presented at conferences and in workshops as established science, decades after educational researchers documented that its foundational numbers have no origin in fact.